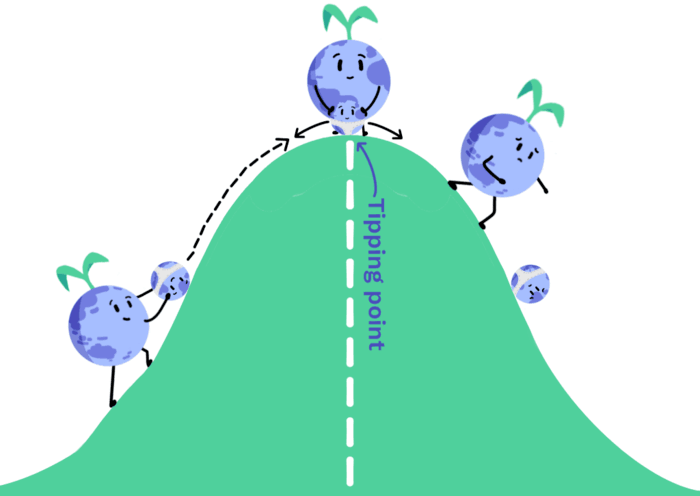
Imagine rolling a ball up a hill. As you walk up the hill, if you push the ball up a bit it will simply roll back into your hands.
However, once you roll the ball over the top of the hill it will keep on rolling away and you’ll lose it. Here, the top of the hill is the ‘tipping point’; at that point, if you give the ball the tiniest extra push it will roll away from you and won’t stop!
Tipping Point Analogy
Normally, our Earth’s systems behave in a similar way to the ball at the bottom of the hill - if we give them a little push by changing them slightly, they will eventually return to their natural state. However, if we cause our Earth system to change a lot (like by hugely increasing the amount of greenhouse gases (GHGs) in the atmosphere), the ball moves to the top of the hill, so any little extra push will cause a huge and irreversible change. This is called a ‘tipping point’.
Crossing a tipping point is irreversible because you can’t go back by undoing the small change. The small change has triggered a system shift, which can be immediate, or delayed years into the future.
Have we passed any tipping points?
Until recently, scientists thought that it was unlikely that we would pass any global-scale climate tipping points this century. However, there is now increasing evidence and agreement that we are closer to crossing tipping points than we thought.
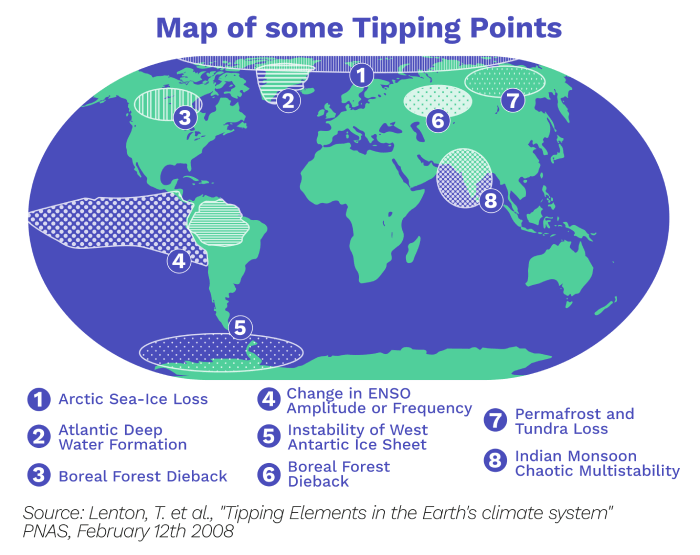
Map of some Tipping Points
Tipping point 1: El Niño Southern Oscillation (ENSO)
Normally in the South Pacific Ocean there are strong winds which blow to the west from South America to Australia. These push the warm surface water to the west, causing cold water from the deep ocean to rise in the east.
Strong western winds
Warm surface ocean water causes air to rise, leading to more cloud and rainfall in the west and, therefore, a flow of air in the atmosphere. This flow of air strengthens the strong winds.
Stable air flow
So where does El Niño come in? Well around every 2-7 years the westerly winds start to weaken due to an unusual change in the distribution of pressure at the surface of the Southern Pacific ocean.
Weaker westerly winds
Due to weaker winds there is less of a push of warm water to the west so less cold water flows up the east and instead you have hot water in the middle of the Pacific Ocean.
El Niño air flow
This is El Niño and it causes a change in wind and air movement patterns in the atmosphere with impacts around the globe. These include increased droughts in Indonesia, India and some parts of Brazil, and increased flooding in Peru. During the El Niño event of 2015/2016 over 60 million people faced difficulties accessing enough food. The map below shows the weather patterns we can expect during an El Niño event:
El Niño Precipitation Impact
If global warming causes the oceans to absorb more heat, the layer of warm surface water could deepen so much that ENSO will pass a tipping point. This would cause El Niño events to permanently become more severe and more frequent. The required global warming to push ENSO across the tipping point is likely to happen this century and the effect will be felt in the next thousand years.
As well as increased flooding in Peru, El Niño will also increase droughts in the Amazon. This makes crossing the next tipping point we’ll look at even more likely.
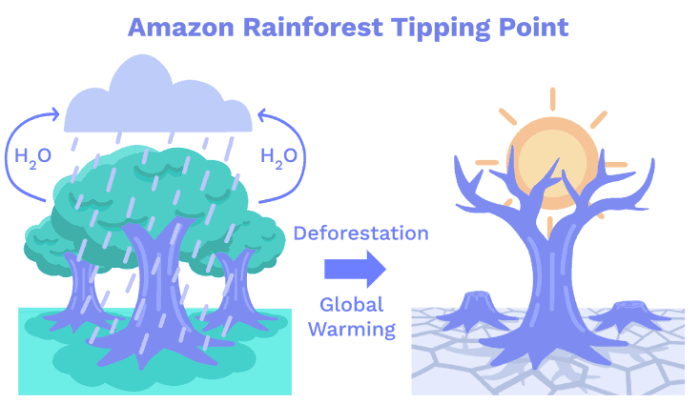
Tipping Point 2: Loss of the Amazon rainforest
The Amazon is so big that it releases a huge amount of water into the atmosphere- more than 8 trillion tonnes per year! This happens during a process called photosynthesis where trees combine water from the ground and CO₂ from the atmosphere to make their food. To take the CO₂ from the atmosphere, trees have to open little holes in their leaves but this means that a lot of water escapes. This water enters the atmosphere and becomes clouds, which keeps the air cool and creates more rain for the trees to grow.
Trees and Water Cycle
Therefore, with significant loss of trees, less water will enter the atmosphere so areas of the Amazon will become drier and drier as the water cycle breaks down. This is already happening in the southern and eastern Amazon, where dry seasons have become longer for at least the past 2 decades.
Global warming will intensify this damage. Along with deforestation, it will lead to increased forest fires, regional droughts and flooding, and destroy biodiversity.
The Amazon will pass a tipping point when the water cycle is so badly ruined that areas of the forest stop producing enough rain for a rainforest to grow. It will be permanently lost and transformed into degraded savannas.
Amazon Tipping point
If we measure the tipping point by global warming alone, many studies suggest temperatures would have to rise by 4°C to cause the central, southern and eastern Amazon rainforest to cross their tipping point.
However, if you take into account the drying effects of deforestation, some say the tipping point will occur even earlier, at 20-40% deforestation. This is particularly alarming as we’ve already cut down 17% of the Amazon rainforest since 1970!
Tipping point 3: Disappearing Arctic sea ice in summer
It does not - in fact every year around 9 million km² (or roughly half the total ice cover) is lost between March and September, but it refreezes again during winter.
However, it is very likely that the amount of ice present during each month of the year decreased between 1979 and 2018. September has experienced the most significant change in ice cover for the past 1,000 years, losing around 83,000 km² per year since 1979! You can see the significance of this in the graph below!
September Arctic Ice Loss
Increased ice melt is caused by high summer temperatures and also due to a feedback loop. This means that ice melting causes even more ice to melt. As the ice melts, more of the ocean surface is uncovered. The ocean surface is darker in colour than ice, so it absorbs more sunlight. Therefore, the more ice melts, the hotter the ocean surface becomes, making it even more likely that more ice will melt!
Ice melt feedback
Arctic sea ice will pass a tipping point when temperatures become so high that further sea ice loss becomes impossible to stop. This will lead to a point in the future where there will be no Arctic sea ice during summer. This is one of the most sudden and likely tipping points found in climate model predictions.
Scientists predict there is a 10-35% chance that a 2°C increase in global temperature will result in unavoidable ice-free summers by 2100. To make matters worse, recent Arctic sea ice loss has been significantly higher than climate model predictions, so the tipping point for summer ice could be crossed much earlier than models predict. Some scientists think we have already crossed it!
Loss of Arctic ice will significantly damage local wildlife and food/water security for indigenous people. It could also impact weather patterns throughout much of the northern hemisphere, impacting many more people, however scientists are not completely sure about the dynamics of this relationship.
Tipping point 4: Melting Antarctic and Greenland Ice Sheets
Another ice-related tipping point is melting ice sheets in Greenland and Antarctica. Ice sheets are huge areas of ice resting on land; if they lose too much ice, they will pass a tipping pointfrom which it’s impossible to stop the remaining ice from melting too. This would lead to sea level rise of several metres in the next few hundred years.
We go into this in more detail in the sea level rise chapter!
Can we trust predictions of tipping points?
There is little agreement about whether any tipping points will be crossed before 2100 due to lack of data and the difficulty climate models face in representing these processes. Therefore, a prediction of a particular tipping point being crossed contains a lot of uncertainty.
Although the best climate models nowadays can consider many abrupt changes in climate, some processes are still unexplained. For example, some models do not include the feedbacks causing the collapse of ice sheets or those causing damage to vegetation.
Ice sheet and vegetation feedbacks are likely to have a more significant impact on tipping points in future centuries because their response is quite slow so we don’t see their results immediately. Their exclusion from models means there could be even more land-based tipping points.
More feedbacks, more tipping points
Conclusion
Many scientists have argued that 2°C global warming is a safe limit to prevent tipping points being crossed.
However, more recently, leading scientists in the field have said we should aim to keep well below 2°C global warming to avoid crossing any tipping points. In fact, when testing 37 potential tipping points, climate models predicted 18 to happen below 2°C! (Remember, we have already warmed our planet by 1.1°C).
This risk is amplified because many experts believe that in the majority of cases, once one tipping point is crossed it is more likely that another will be crossed, meaning multiple tipping points could occur at the same time. Like setting off a chain reaction!
Therefore, scientists are urging for immediate international action on unsustainable practices (like burning fossil fuels and deforestation) to take place to avoid the risks of tipping points.