Global Warming: How does today's climate compare to history and the future?
8 minute read
Updated on: 03 Mar 2021
https://climatescience.org/advanced-climate-future-temperatures/
How have temperatures changed in the past?
The graph below shows how the Earth’s temperature has changed over the last 65 million years, and how it is predicted to change in the future![]() . Notice that as you get closer to the present day the graph zooms into shorter timescales.
. Notice that as you get closer to the present day the graph zooms into shorter timescales.
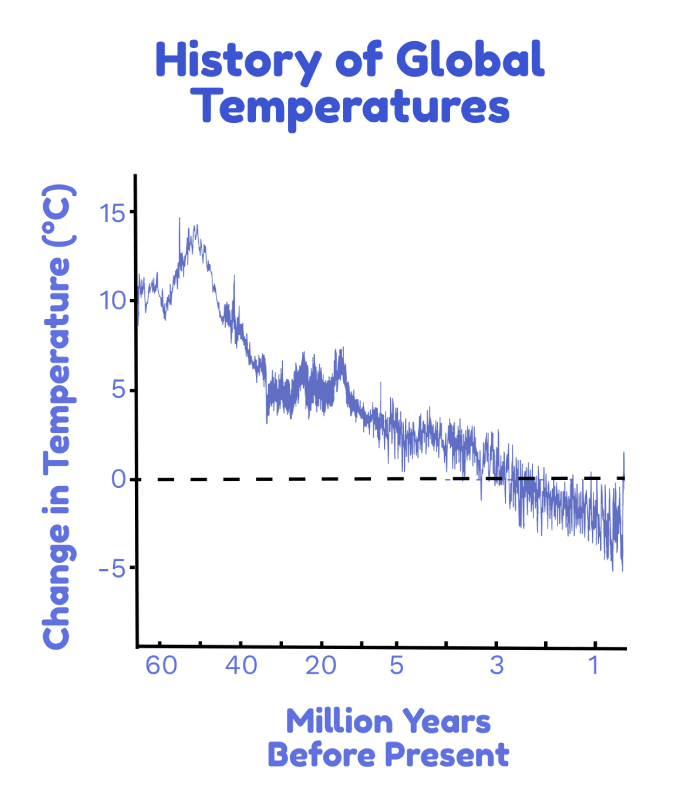
History of Global Temperatures![]()
From looking at this, you would be forgiven for thinking that current climate change is no different from past increases in temperature. However, can you see from the graph that if little climate action is taken in the future (the orange line)![]()
![]()
![]() then by 2100 Earth’s average temperature will increase to roughly 4.5°C above the pre-industrial levels
then by 2100 Earth’s average temperature will increase to roughly 4.5°C above the pre-industrial levels![]()
![]()
![]() ?
?
Back then humans![]() , and even mammoths
, and even mammoths![]() , had not evolved yet!
, had not evolved yet!

Same Temperatures in History![]()
![]()
This graph below shows more recent changes in temperature:
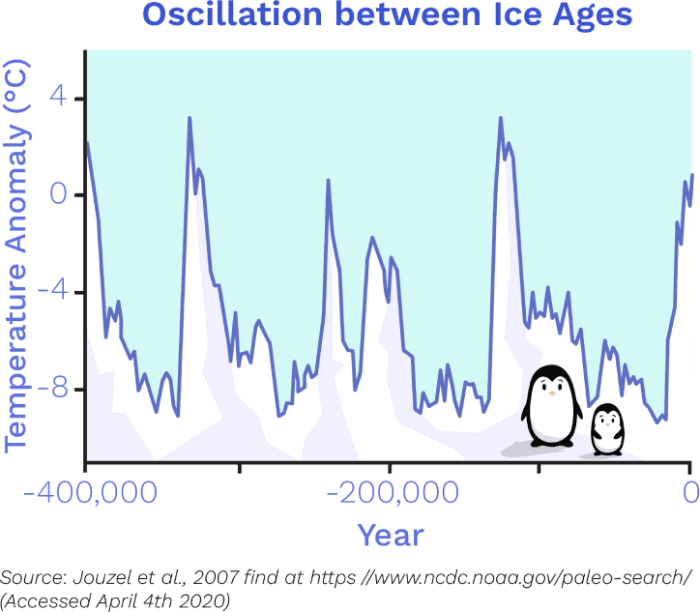
Oscillation between Ice Ages![]()
Over the last 1 million years, Earth has oscillated between ice ages and warmer periods![]()
![]() . This was not caused by humans, but by changes in the energy radiated by the Sun
. This was not caused by humans, but by changes in the energy radiated by the Sun![]() , the Earth’s orbit around the Sun, and the angle at which the Earth rotates
, the Earth’s orbit around the Sun, and the angle at which the Earth rotates![]()
![]()
![]() .
.
These changes in temperature were very gradual![]() , with no more than 1°C of change in the global average temperature over the past 10 thousand years
, with no more than 1°C of change in the global average temperature over the past 10 thousand years![]() . This stability facilitated the development of human civilisation
. This stability facilitated the development of human civilisation![]() .
.
How are temperatures changing now?
Until recently, the Earth was in a natural cooling phase, which started around 5 thousand years ago![]() . This cooling was heading towards a new ice age, due in about 1.5 thousand years
. This cooling was heading towards a new ice age, due in about 1.5 thousand years![]() . However, after around 1850
. However, after around 1850![]() , global temperatures started to rise dramatically
, global temperatures started to rise dramatically![]()
![]() .
.
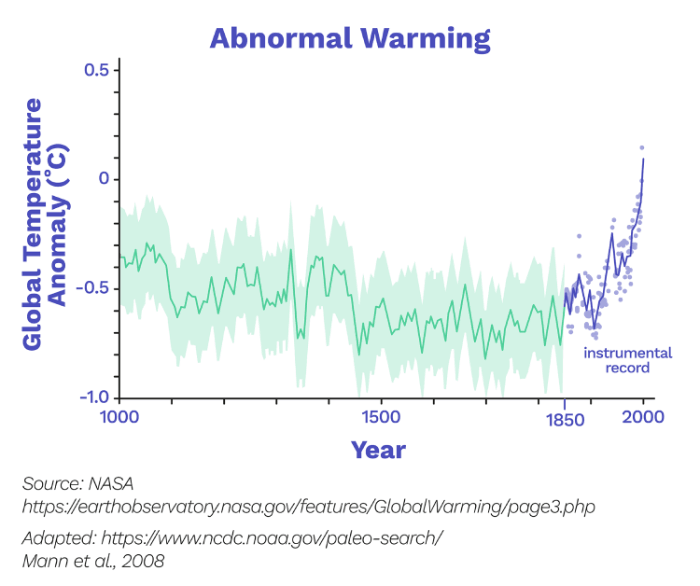
Abnormal Warming![]()
For the past 250 years, humans have been releasing greenhouse gases into the atmosphere![]() , causing the Earth to warm by roughly 1.1°C
, causing the Earth to warm by roughly 1.1°C![]() when it otherwise would be cooling
when it otherwise would be cooling![]() !
!
Why worry about climate change today?
The Earth is warming abnormally quickly![]() . Over the past century it has warmed roughly 10 times faster than the average increase in temperature after each ice age
. Over the past century it has warmed roughly 10 times faster than the average increase in temperature after each ice age![]() .
.
Despite there being similarly rapid and large changes in temperature in the distant past![]()
![]() , current global warming is dangerous because humans have not experienced changes of this scale and speed before
, current global warming is dangerous because humans have not experienced changes of this scale and speed before![]() so it will be challenging for us to adapt
so it will be challenging for us to adapt![]()
![]() .
.

Difficulty in adapting
Future temperature rise
The more greenhouse gas we release the more temperatures will rise![]() . As the planet warms, melting ice, thawing permafrost, and other responses from the Earth itself will make temperatures rise even more
. As the planet warms, melting ice, thawing permafrost, and other responses from the Earth itself will make temperatures rise even more![]()
![]() .
.
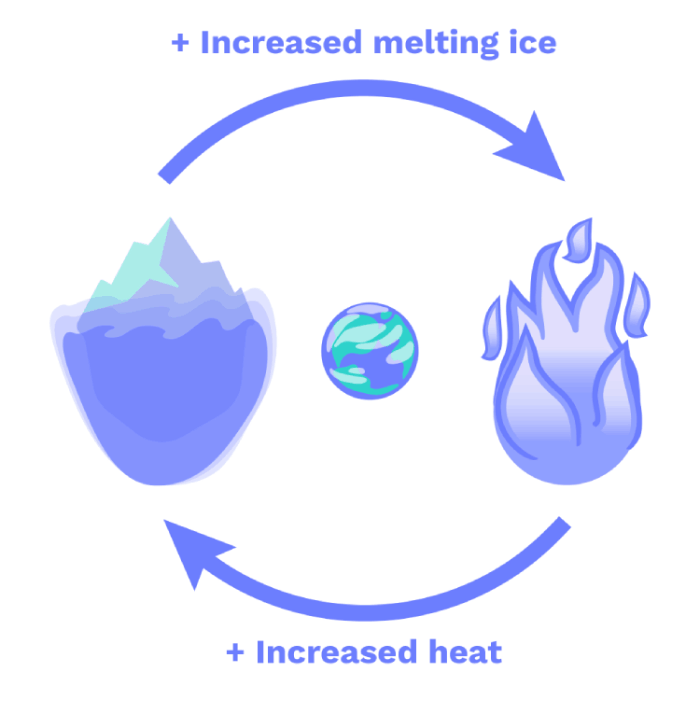
Positive Feedback
How much greenhouse gas we release depends mainly on how much energy we use, and how it is produced![]()
![]() . These factors are dictated by politics, economics
. These factors are dictated by politics, economics![]()
![]() , population growth and energy use per person.
, population growth and energy use per person.
Climate modellers use several different well-considered scenarios of human behaviour to predict different possible future changes in temperature![]()
![]() . These predictions, along with a range of possible results, are shown in the graph below
. These predictions, along with a range of possible results, are shown in the graph below![]() .
.
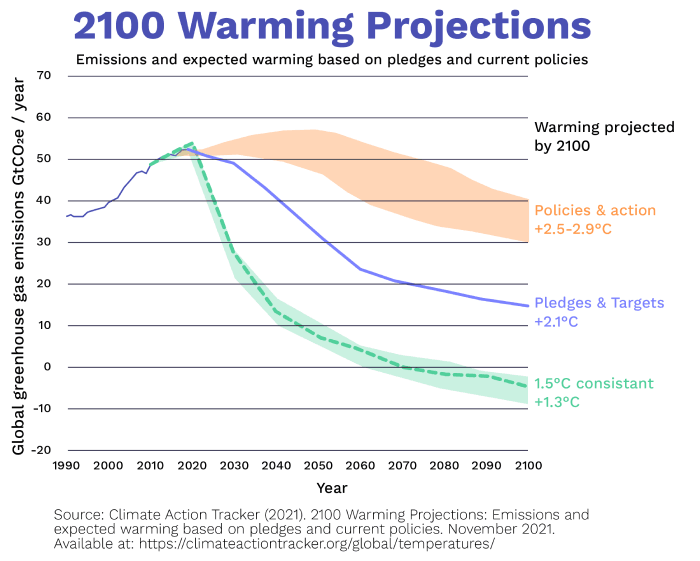
Future Temperature Predictions![]()
The light green line in this graph represents a future where there is no change or addition to current climate policies![]()
![]()
![]() . It’s estimated that this would cause 4.5°C of global warming by 2100
. It’s estimated that this would cause 4.5°C of global warming by 2100![]()
![]() .
.
If we implement climate policies such that CO₂ emissions peak at roughly 40Gt per year around 2040![]()
![]() and become roughly constant at 15Gt per year after 2080
and become roughly constant at 15Gt per year after 2080![]() , the light blue line is more likely. This corresponds with 2.5°C of warming by 2100
, the light blue line is more likely. This corresponds with 2.5°C of warming by 2100![]()
![]() .
.
The dark blue purple represents a future where extremely rigorous and strict climate policies![]() are put into place during the 2020’s
are put into place during the 2020’s![]() . This would still cause 1.6°C of global warming by 2100
. This would still cause 1.6°C of global warming by 2100![]()
![]() .
.
Uneven warming
By looking at average warming of the planet, we ignore the fact that the surface of the Earth doesn’t warm evenly![]()
![]() .
.
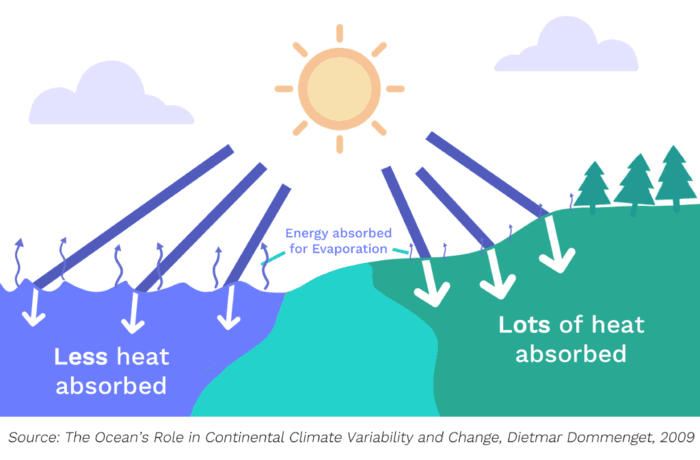
The sea is cooler than the land mainly because a larger proportion of the Sun’s heat energy is used to evaporate water rather than being absorbed to increase the sea surface temperature![]()
![]() .
.
Ocean cooler than Land
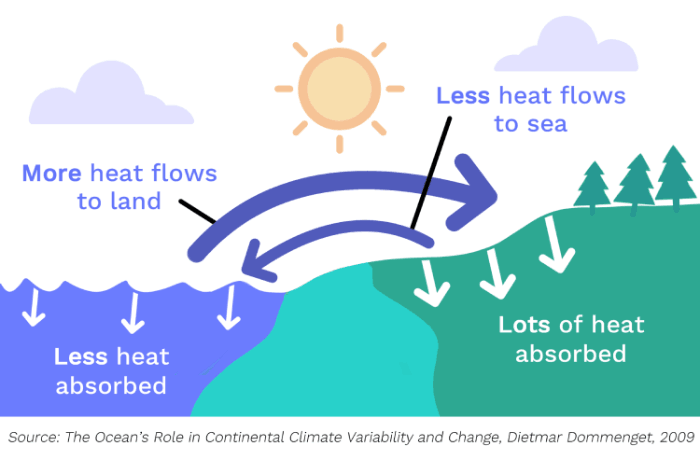
This evaporation not only means that the sea warms less than the land but it also causes more heat to flow from the oceans to the land than from land to oceans, so the difference in temperature increases even further![]() ! Evidence suggests 80-90% of warming on land is caused indirectly by heat moving from warming oceans
! Evidence suggests 80-90% of warming on land is caused indirectly by heat moving from warming oceans![]() .
.
Ocean Land Heat Transfer
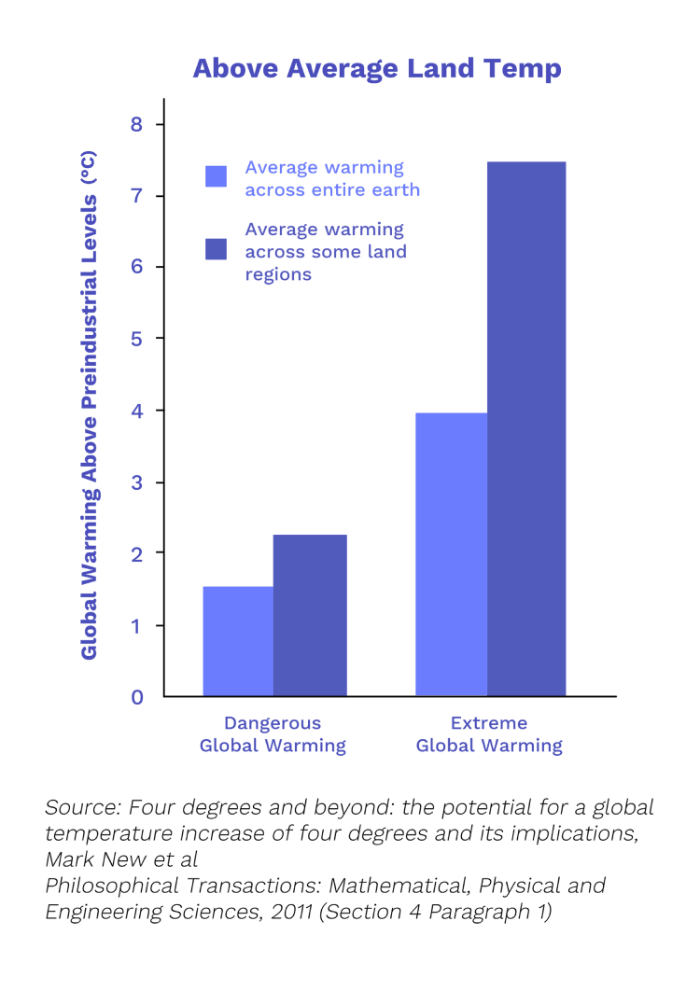
Therefore, many land areas are experiencing greater warming than the global average![]()
![]()
![]() . For example, when the global warming above pre-industrial levels has an average value of 1.5°C or 4°C across the Earth, the average value across some land regions will be 2.25°C
. For example, when the global warming above pre-industrial levels has an average value of 1.5°C or 4°C across the Earth, the average value across some land regions will be 2.25°C![]() or 7.5°C respectively
or 7.5°C respectively![]() .
.
Land Hotter than Average
The Arctic is warming 2-3 times faster than the global average![]()
![]() , resulting in knock-on climate effects in other areas of the world
, resulting in knock-on climate effects in other areas of the world![]() . This is because when ice melts it exposes a darker surface which reflects less sunlight
. This is because when ice melts it exposes a darker surface which reflects less sunlight![]()
![]()
![]() .
.
How are temperatures going to change under current policy?
As part of the Paris Agreement, every country pledged to limit global temperature rise to well below 2°C above pre-industrial levels, and preferably below 1.5°C![]()
![]() . Most countries have set out how they will try to achieve this under policies called Nationally Determined Contributions (NDCs)
. Most countries have set out how they will try to achieve this under policies called Nationally Determined Contributions (NDCs)![]() .
.
However, if we look at the promises to reduce greenhouse gas emissions within these NDCs, currently over 7 out of 10 countries won’t succeed in achieving their Paris Agreement pledges![]() ! In fact, on average emission reduction promises must become 5 times more effective within the next decade to keep temperatures below 1.5°C
! In fact, on average emission reduction promises must become 5 times more effective within the next decade to keep temperatures below 1.5°C![]()
![]()
![]() .
.

5-fold increase needed![]()
Conclusion
Many scientists believe we have little hope of restricting global warming to 1.5°C or even 2°C![]()
![]()
![]()
![]()
![]()
![]() . If global warming continues at its current rate there is a 66% chance that we will reach 1.5°C of warming between 2030 and 2052
. If global warming continues at its current rate there is a 66% chance that we will reach 1.5°C of warming between 2030 and 2052![]()
![]() .
.
But global warming is actually getting faster and faster![]() so drastic action must be taken now to reduce emissions to limit these rising temperatures
so drastic action must be taken now to reduce emissions to limit these rising temperatures![]()
![]() . You’ll learn more about the solutions to this problem in later courses but for now let’s move on to look at how this temperature rise will affect sea levels.
. You’ll learn more about the solutions to this problem in later courses but for now let’s move on to look at how this temperature rise will affect sea levels.
https://climatescience.org/advanced-climate-future-temperatures/