Emissions by End-Use: What Activities Create the Most Emissions?
8 minute read
Updated on: 04 Mar 2021
https://climatescience.org/advanced-emissions-by-product/
In the last chapter we categorised emissions based on which sector they came from. There are other ways of looking at emissions, including by end-use or activity. This breaks down emissions within each sector to look at the final product or activity emissions are used for ![]() .
.
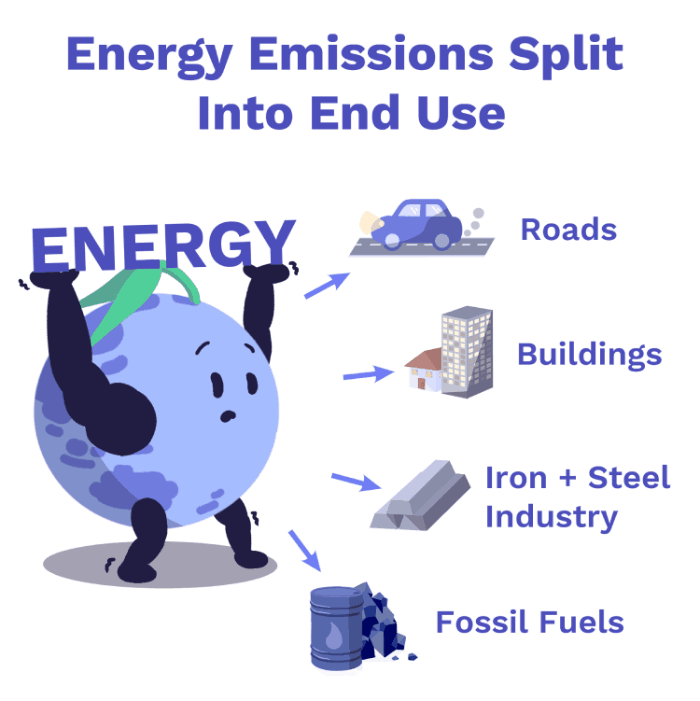
Breakdown of end uses within the energy sector ![]()
Why is it useful to categorise emissions by end use?
Categorising emissions by end-use gives us a better understanding of the particular activities or products that are responsible for causing emissions ![]() .
.
This is useful for working out how to reduce them. For example, we will see that buildings account for 17.7% of energy emissions ![]() . This information may lead governments to improve insulation so that less energy is wasted by inefficient heating and cooling of these buildings
. This information may lead governments to improve insulation so that less energy is wasted by inefficient heating and cooling of these buildings ![]() .
.
Which products cause the most emissions?
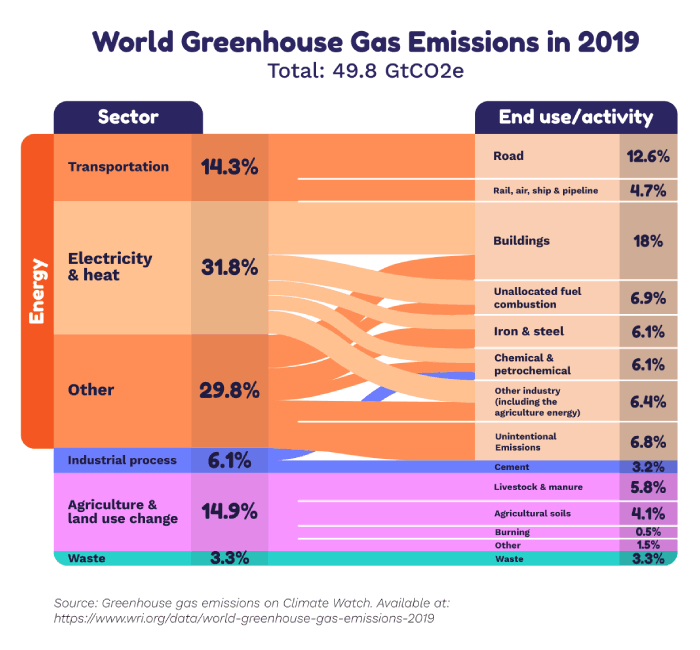
Emissions from different sectors and end uses ![]()
The right-hand column of the chart shows emissions by end-use activities. This redistributes emissions from the sector they are produced in, and instead assigns them to their final uses ![]() .
.
This particularly makes a difference for the energy sector, which produces energy for a wide range of end uses. Responsibility for emissions can be reallocated from the energy supply sector to the activities or products that use that energy ![]() .
.
An example is emissions from the use of fuels to produce heat or electricity for houses and apartments. This is produced by the energy sector, but used within buildings ![]() .
.
Which end uses/activities are the worst for the planet?
Activities on roads account for 11.9% of global greenhouse gas emissions ![]() .
.
This includes emissions from laying the roads and emissions from vehicles that travel on these roads, including cars, trucks, and buses ![]() .
.
It also includes emissions from producing and trading these vehicles ![]() .
.
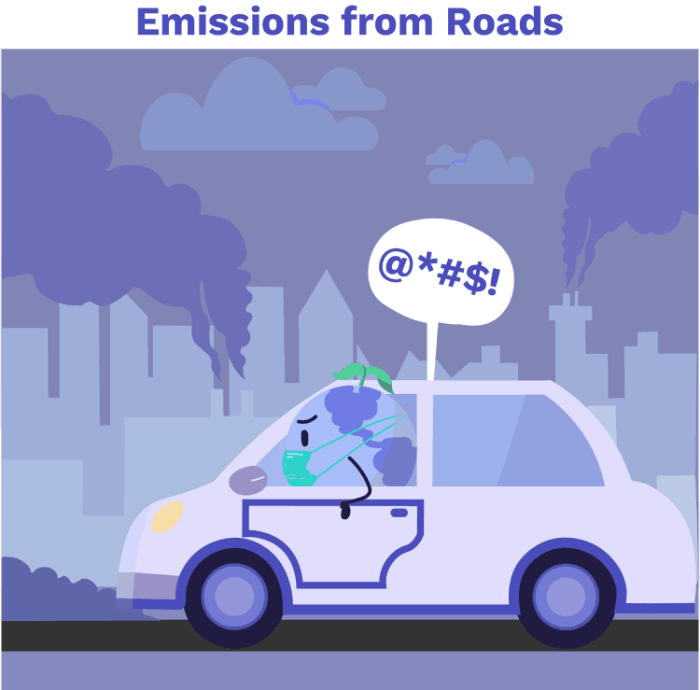
Emissions from roads
The buildings we live and work in account for even more, releasing 17.7% of global CO₂e emissions ![]() . This includes the electricity used in lighting, appliance use (anything plugged into a socket, from toasters to hairdryers), refrigeration and air conditioning, as well as the heat to warm our houses and workplaces and any direct fuel use such as gas
. This includes the electricity used in lighting, appliance use (anything plugged into a socket, from toasters to hairdryers), refrigeration and air conditioning, as well as the heat to warm our houses and workplaces and any direct fuel use such as gas ![]() .
.
When it comes to industry, the iron and steel industry is one of the largest energy-consuming industries in the world ![]() , accounting for 7.2% of greenhouse gas emissions
, accounting for 7.2% of greenhouse gas emissions ![]() .
.
CO₂ is emitted at various points when making steel, including when fuels are burnt on-site (70%), and the indirect emissions from electricity and heat used during the production process (30%) ![]() .
.
Global demand for steel is still increasing, so without intervention, this sector may produce even more greenhouse gas in the future ![]() .
.

Earthly making steel
What is a “supply chain” and why are they important?
All the stages involved in the creation of a particular product - getting the resources, producing it, transporting it, and using and disposing of it - are collectively referred to as the supply chain ![]() .
.
When we categorise greenhouse gas emissions by end use, the emissions from each stage of the supply chain count towards the emissions caused by the final end product.
Let’s have a look at what this means in the food supply chain and the fashion supply chain.


